Learning Outcomes

Machine Learning

AI generated with ChatGPT 4o
  1. Articulate the legal, social, ethical and professional issues faced by machine learning professionals.
  2. Understand the applicability and challenges associated with different datasets for the use of machine learning algorithms.
  3. Apply and critically appraise machine learning techniques to real-world problems, particularly where technical risk and uncertainty is involved.
  4. Systematically develop and implement the skills required to be effective member of a development team in a virtual professional environment, adopting real-life perspectives on team roles and organisation.
Collaborative

The Fourth Industrial Revolution

Topic

Reviewed Schwab's (2016) article on Industry 4.0's automation and its impact on a media sector information system failure.

Outcomes

What (1)

Explained evolution to Industry 5.0's augmentation, Channel 4's regulatory failure when Red Bee Media service outage occurred due to an automated response, and mitigation (Ofcom, 2022; Ziatdinov et al., 2024)

So What (4)

Peer responses to others identified areas missed in my own analysis, like personal costs, not just monetary impact, by seeing it missing in their writing.

Now What / Feedback (3)

Summary contradicted peer feedback on interconnectedness and utilising cloud computing but concurred on mitigation via disaster recovery and communication (Adams, 2024; Zapka, 2024).

Skills

Disaster recovery, Industry 4.0, Industry 5.0

EDA Tutorial

AutoMPG dataset

EDA Correlation

FIGURE 1 | Correlation

Topic

Exploratory Data Analysis (EDA) on AutoMPG dataset using Google Colab.

Outcomes

What (2)

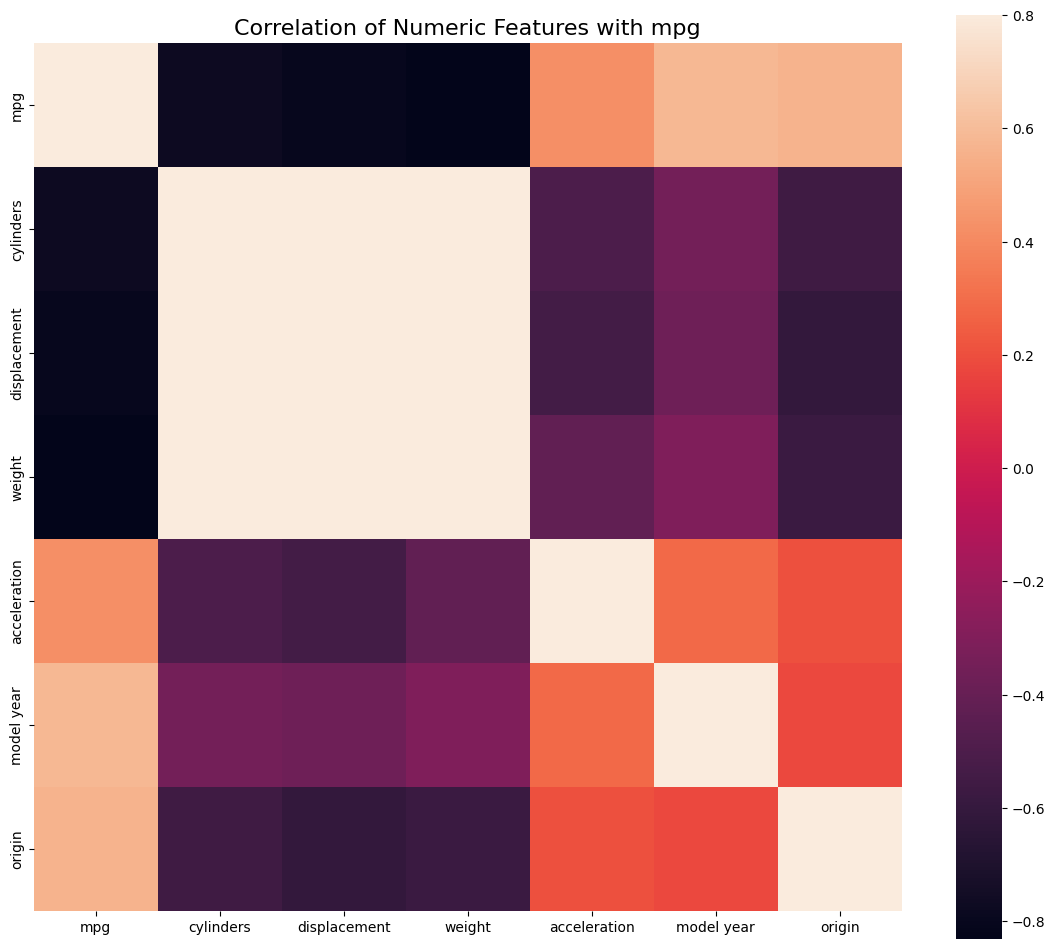
EDA discovered horsepower was nominal because it contained “?”. High negative correlation (Figure 1) indicates lower miles per gallon (MPG) for higher weight, displacement and cylinders.

So What (2)

Missing values can take unexpected forms, so text-based EDA is essential, in addition to visualisations (Oluleye, 2023).

Now What (2)

Use range of tools in future EDA.

Feedback (4)

Shared experience in Seminar 2. Positive feedback on my "Using Google Colab with GitHub".

Skills

Google Colab, GitHub, Matplotlib, Missingno, NumPy, Pandas, Python, Seaborn, SciPy

Regression

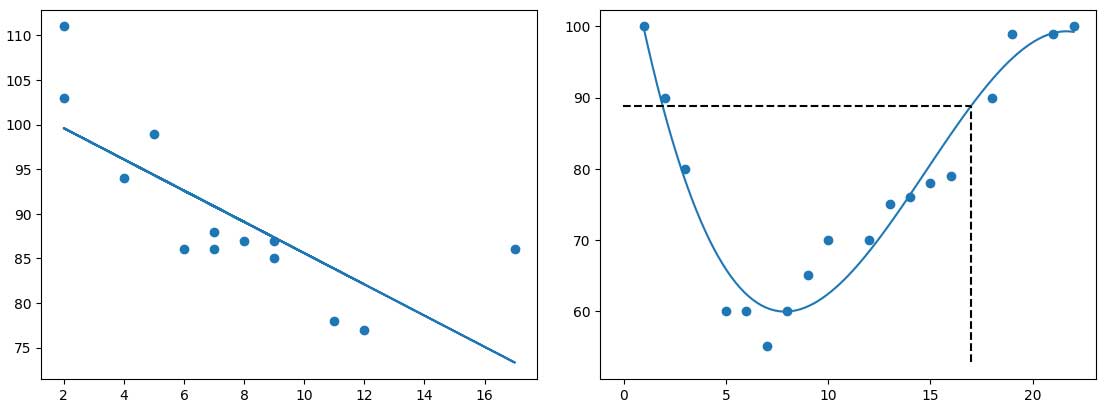
FIGURE 2 | Linear versus polynomial regression

Topic

Correlation and regression.

Outcomes

What (2)

Experimented with bivariate (two variables) covariance (directional relationship), and Pearson's Correlation (linear relationship). Performed linear and polynomial regression and experimented with multiple regression coefficient.

So What (2)

Covariance impacted by changes in standard deviation (sd). Pearson Correlation not affected by shifts to mean or sd (Oluleye, 2023). Regression predicts y from x, but polynomial uses a non-linear relationship (Figure 2).

Now What (1)

Linear relationships can use Pearson's Correlation and linear regression. Non-linear could use polynomial regression.

Skills

Google Colab, GitHub, Python, NumPy, Matplotlib, Seaborn, SciPy, Pandas, Scikit-Learn

Linear Regression

With Scikit-Learn

Linear and Log-Linear Regression

FIGURE 3 | Linear versus Log-Linear Regression

Topic

Correlation and linear regression with Scikit-Learn.

Outcomes

What (2)

Pre-processed population and gross domestic product (GDP) data per country (2001-2021), investigated Pearson Correlation coefficient, and performed linear regression.

So What (2)

Discovered missing NaN values, missing 2021 column in global_GDP, and global_population as all objects instead of numeric. Pre-processing created usable data (Oluleye, 2023).

Now What (2)

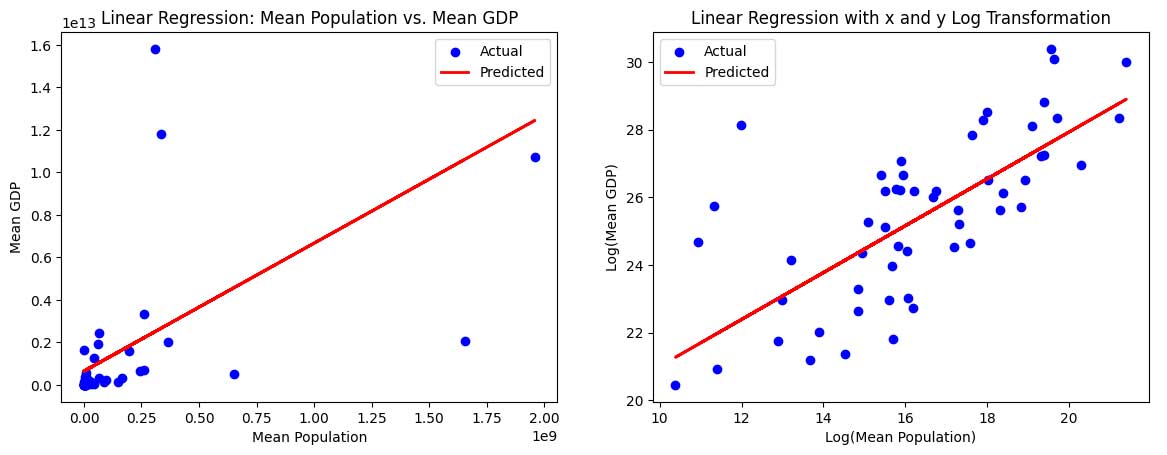
Learned linear regression is not just one type. Data may need further transformation, like logarithmically (Figure 3), to be meaningful.

Skills

Google Colab, GitHub, Matplotlib, Pandas, Python, Scikit-Learn

Jaccard
FIGURE 4 | Jaccard

Topic

Calculate Jaccard coefficient.

Outcomes

What (1, 2)

Asked to calculate the Jaccard coefficient (similarity) but the lecturecast and assignment use Jaccard distance formula (dissimilarity).

So What (2)

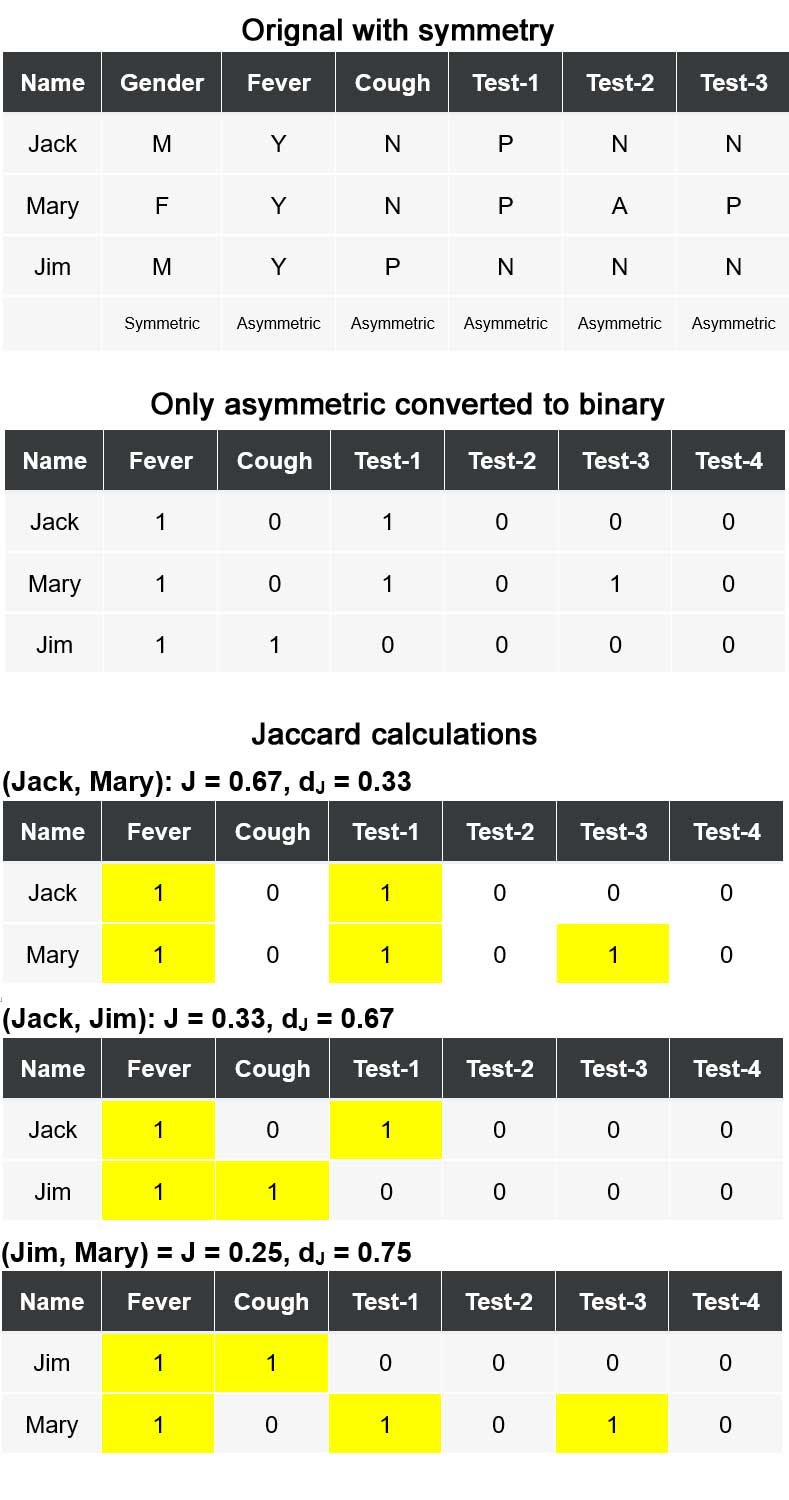
Jaccard coefficient is J = f11 / (f01 + f10 + f11), or intersection divided by union. Jaccard distance is dJ = f01 + f10 / (f01 + f10 + f11), or 1 - J (Chung et al., 2019).

Now What (2)

Figure 4 excludes symmetric features like gender, uses asymmetry, and combines terms to get 0 or 1, where only 1 means attribute present. Now able to apply Jaccard coefficient or distance.

Skills

Jaccard coefficient and distance.

Cluster Mean Analysis

FIGURE 6 | Airbnb NYC cluster mean analysis

Topic

Team assignment to analyse, visualise, and report on Airbnb New York City (NYC) 2019 dataset (Kaggle, 2021).

Outcomes

What (2, 4)

Collaboratively delivered EDA, pre-processing, statistical analysis, data visualisation, and unsupervised machine learning (ML) using k-means clustering (Oluleye, 2023). Teamwork split into project management, coding, merging, and report writing.

So What (2, 4)

Figure 6 shows cluster-specific strategies are key to optimising revenue; however, regulation and saturation need to be considered. With a team new to ML, coding and report writing were iterative. Due to being virtual across time zones, document sharing used Google Drive, planning used Trello, and discussion used WhatsApp and Google Meet. Coding and report writing followed EDA within Cross Industry Standard Process for Data Mining (CRISP-DM) (Niakšu, 2015, Mukhiya & Ahmed, 2020; Oluleye, 2023).

Now What (2,4)

As our first practical machine learning coding, there was a steep learning curve for all. Subsequent assignments, such as feature reduction techniques, illustrate steps that could be taken with k-means clustering. Future development requires a deeper understanding of other machine learning techniques. Further experience with GitHub identified mistakes to be avoided in future collaborations.

Skills

EDA, k-means clustering, Matplotlib, Numpy, Pandas, Python, Scikit-Learn, Seaborn.

Feedback

Distinction. Tutor calls it an "impressive submission" that is clearly articulated with a thorough EDA and practical and actionable specific recommendations. Very positive team feedback: all felt this group would work well professionally.

k-means Tutorial

FIGURE 7 | k-means Tutorial

Topic

Perform three k-means clustering tasks on datasets: A: Iris, B: Wine, C: WeatherAUS (Figure 7).

Outcomes

What (2, 3)

Explore, preprocess, cluster, compare, and visualise data (Oluleye, 2023).

So What (1, 2, 3)

Iris dropped species class for comparison. Three clusters achieved 64.1% accuracy. Figure 7 shows cluster 1 matched exactly but 0 and 2 overlapped. Wine class dropped for comparison. With three clusters, 89.7% match. Confusion matrix showed perfect matches for clusters 2 and 3 and almost perfect for 1. WeatherAUS dropped categorical and imputed missing data, and reduced features using Principal Component Analysis (PCA). Clearest relationships for k=3 within temperature, wind, and humidity.

Now What (3)

Understand data, including class, and pre-process. Use feature reduction like PCA for larger datasets. Visualising helps understand cluster effectiveness, such as overlapping reducing accuracy.

Skills

EDA, k-means clustering, PCA, Python, Scikit-Learn, Seaborn.

Perceptron Tutorial

FIGURE 8 | Multi-layer perceptron error by epochs

Topic

Understand perceptron and weights in artificial neural networks (ANNs) (Kubat, 2021).

Outcomes

What (2)

Simple perceptron used two inputs, applied weights, summed, and applied step function returning output 0 or 1 with no hidden layer. Perceptron AND operator trained a single-layer perceptron (no hidden layer) to deliver binary classification (output 0 or 1) for binary AND operator. Multi-layer perceptron solved XOR using a hidden layer with a sigmoid activation function.

So What (2)

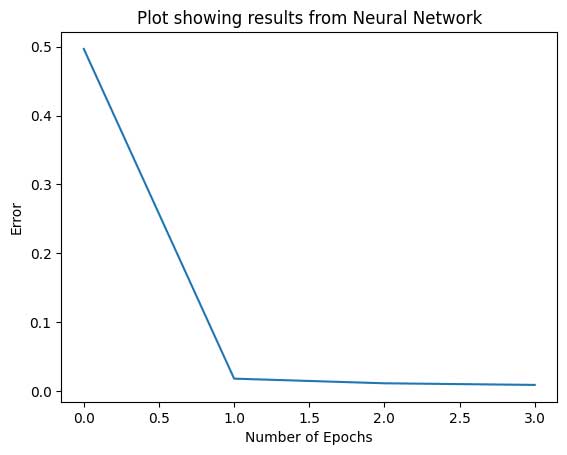
Simple perceptron result depended on inputs and weights. The perceptron AND operator reduced the error between predicted and actual outputs to zero, with training updating weights based on the error and learning rate. New instances could then be classified. Figure 8 shows the prediction error for the multi-layer perceptron reducing over training epochs to converge toward actual XOR values.

Now What (2)

This provides a foundation of understanding for how perceptrons in ANNs work.

Skills

Numpy, perceptron, weights, Matplotlib, Python

Gradient Descent Tutorial

FIGURE 9 | Gradient descent cost function

Topic

Read Mayo (2017) and observe how cost function decreases by changing number of iterations and learning rate.

Outcomes

What (2)

Find linear equation (y = mx + b) best representing input x and output y using a mean squared cost function to reduce error between actual and predicted values over several iterations at a learning rate (Mayo, 2017).

So What (2)

Iteration is number of steps. Too many could overfit. Too few may miss minimum error. Learning rate controls step size. Too big can overshoot minimum. Too small could take unnecessarily long (Kubat, 2021).

Now What (2)

Understand doubling learning rate could overshoot minimum exponentially, while halving may not reach minimum. However, if it has not fully converged, increasing iterations can help (Figure 9).

Skills

Numpy, cost function, gradient descent, Python

Topics

Views on Pruciak's (2021) use of Artificial Neural Network (ANN) in personalisation, and Centre for Data Ethics and Innovation (2019) paper on Artificial Intelligence (AI) in insurance.

Outcomes

What (3)

ANNs can be used for Netflix's recommender systems (Steck et al., 2021). Concerns on AI in insurance include privacy, becoming uninsurable, and intrusive advertising.

So What (3)

ANNs help find relevant content, but deep learning can amplify recommender weaknesses and bias (Steck et al., 2021; Gonzalez et al., 2022). Precedent for non-standard cases like the Grenfel fire favoured cladding creators and property developers over individuals.

Now What (3)

Solely using ANNs for recommendations risks a filter bubble without potential for discovery. AI in insurance issues from 2019 are addressed by the European Union (EU) AI Act, but this regulatory protection is not global (Flamind & Sonner, 2024).

Skills

ANNs, ethics, EU AI Act

Collaborative

Legal and Ethical Views on ANN Applications

Topic

Read Hutson (2021) and discuss benefits and risks of AI writing.

Outcomes

What (3)

Large language models (LLMs) from Generative Pretrained Transformer 3 (GPT-3) onwards are used for writing.

So What (3)

GPT can draft and prompt imagination, but critical thinking, fact-checking, legislative, and ethical considerations are needed (Timsit, 2023; Liu et al., 2024; Wiggers, 2024).

Now What / Feedback (3, 4)

Skills

ANN, GPT, ethics, LLM, regulation

CNN Model Tutorial

FIGURE 10 | CNN prediction

Topic

Convolutional Neural Networks (CNNs).

Outcomes

What

Read Wall (2019) and deliberate ethics and social impact of CNNs. Predict further images using CNN on CIFAR-10 dataset (Figure 10).

So What (1, 2)

Facial recognition by police risks bias resulting in inaccuracy. Learned basic training, evaluating and predicting with a CNN on image data.

Now What (1, 2)

Foundation for understanding CNN coding coupled with understanding risk. EU AI Act has since made some facial recognition an unacceptable risk (European Parliament, 2023).

Skills

CNN, keras, Matplotlib, NumPy, Scikit-Learn, tensorfolow

Flat White as Espresso

FIGURE 11 | CNN predicting flat white as espresso

Topic

Wang et al.'s (N.D.) CNN tutorial.

Outcomes

What

Interactive CNN example and documentation.

So What (2)

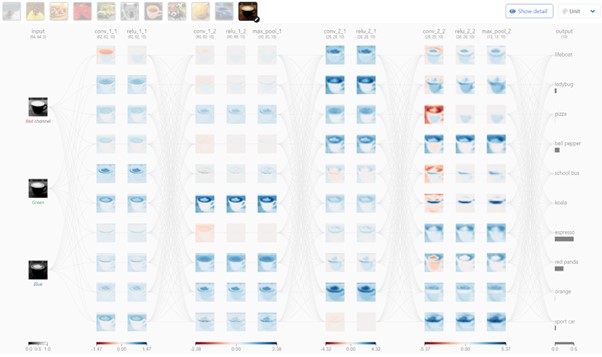
Explained layers and flow from input to convolutional through Rectified Linear Activation functin (ReLU), then pooling and flattening with softmax to classify probability.

Now What (2)

Clearer CNN understanding and criticaly considered why Miata did not identify as sportscar but flat white did as espresso with a bit of red panda (Figure 11).

Skills

CNN, pooling, ReLU, softmax

ROC AUC and R-squared

FIGURE 12 | ROC AUC and R-squared

Topic

Receiver Operating Characteristics area underneath the curve (ROC AUC) and R-squared (Bruce et al., 2020)

Outcomes

What

Changed ROC AUC and R-squared parameters and observed impact.

So What (1)

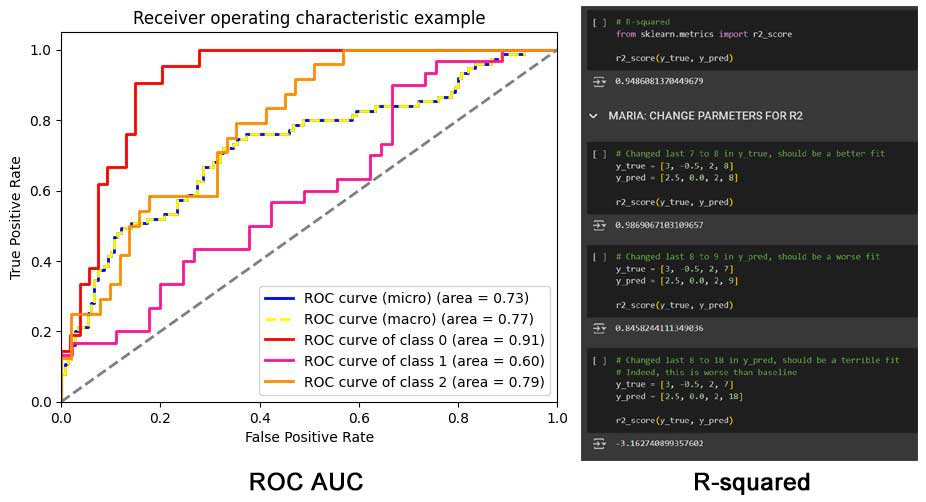
ROC AUC for micro-average (0.73), macro-average (0.77), and weighted-average (0.75) are similar while the iris classes vary (Figure 12). R-squared typically ranges 0 to 1, with 0 at baseline and perfect prediction at 1 (Bruce et al., 2020). A negative value shows predicting worse than baseline is possible (Figure 12).

Now What (1)

The books do not explain that negative R-squared exists, so understanding what creates it is useful.

Skills

Accuracy, confusion matrix, F1-score, precision, recall, ROC AUC, R-squared

Topic

Read Diez-Olivan et al. (2019).

Outcomes

What (2)

There are three Industry 4.0 prognostic ML models: descriptive, predictive, and prescriptive.

So What (3)

For the Red Bee Media broadcast centre incident, descriptive incorrectly detected fire, predictive missed fire sensor failure, and crucially, prescriptive disaster recovery failed.

Now What (1)

Prescriptive disaster recovery is essential to ensuring broadcast remains on air and regulatory compliance.

Skills

Prognosis: descriptive, predictive, prescriptive

Outcomes

What

My SWOT analysis captured my strengths as a media technology professional with 30 years' experience, opportunities for public speaking, and service as a student representative and module WhatsApp facilitator. It also noted my weakness in balancing quality with self-care, and the threats of course errors and less relevant material (MindTools, N.D.). My skills matrix showed growth in ethics, critical writing, research methods, and statistical analysis in Excel. I enthusiastically engaged in assignments relevant to AI in media.

So What

Despite these achievements, much of the coursework focused on methodology, writing, mathematics, and reflecting, requiring me to seek AI expertise through external sources. Furthermore, module errors hindered efficiency. Balancing coursework with staying relevant meant dedicating time to less relevant topics, impacting self-care and professional growth.

Now What

My action plan aims to mitigate these challenges (Cottrell, 2021). I will continue to combine industry and academic research, build expertise through public speaking, and supplement with external training. My student WhatsApp group supports collectively addressing course errors. However, as I prioritise knowledge, academic quality, and timely delivery, my biggest challenge remains allocating time for self-care.

Outcomes

What

This e-portfolio reflected on research method processes. Appraising issues (1) through ethics and survey use reflections showed practical insights from industry research, such as OECD.AI's (2024) AI Principles, were often missing in academic contexts. Moreover, employing academic investigation (2) in the literature review demonstrated the need for industry examples like Steck et al. (2021).

So What

The collaborative learning loop process highlighted the importance of thorough review and critical evaluation (3), as seen in the misinterpretation of Milyavsky et al. (2017) and conflict of interest by Godlee et al.'s (2011) publisher. These exemplified the potential for researcher bias or error. Critically evaluating Dawson's (2015) and Saunders et al.'s (2019) methods (4) for the research proposal helped me ascertain suitability. Discovering Page et al.'s (2021) PRISMA guidelines and comparing industry and academic research helped me identify a critical research gap.

Now What

I will apply critical evaluation skills to all stages of my research, using tools like PRISMA guidelines to systematically structure reviews. I will continue seeking feedback to refine my writing and critical thinking skills. Integrating industry and academic research will help me maintain a balanced perspective and ensure professional applicability.