Learning Outcomes

Numerical Analysis

AI generated with Bing
  1. Systematic understanding of the key mathematical and statistical concepts and techniques which underpin mechanisms in Data Science and AI.
  2. Apply mathematical and statistical methods in these fields to help in the decision-making process.
  3. Critically evaluate the use of statistical analysis and the numeric interpretation of results as aids in the decision-making process.
  4. Critically appraise and present results of a statistical analysis to a diverse audience.

Learning Outcomes

  • Outcome 1. Studied 210 hours (including Khan Academy statistics and probability), with 748 pages of notes, to understand core mathematical and statistical concepts.
  • Outcome 2. Applied mathematical and statistical methods to hypothetical questions.

SKills

  • Statistical. Frequency tables, mean, median, mode, t-test.
  • Technical. Excel, R.

Tutor Feedback

93% (Distinction).

Topic

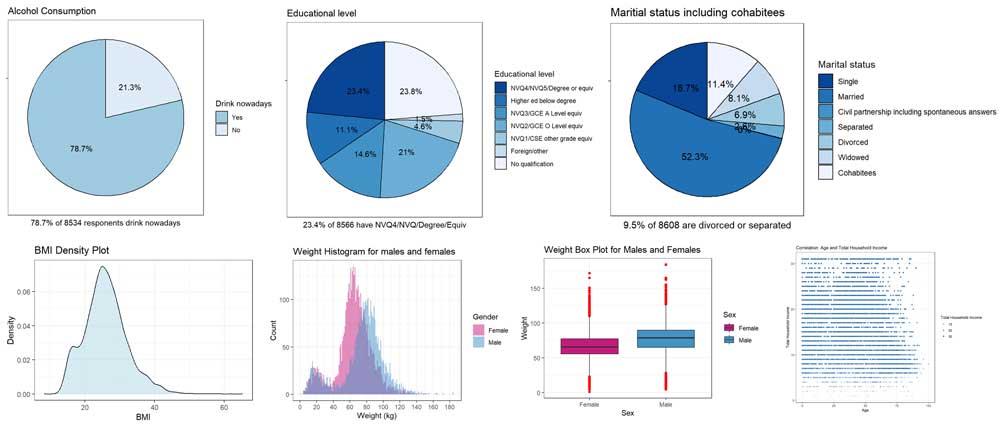
Using 2011 Health Survey for England data, provide descriptive and inferential statistics on gender and alcohol, alongside relevant literature, a discussion of findings, conclusion and recommendations. Provide code in R, a presentation and transcript (1000-1500 words).

Statisitcal Analysis Presentation

Learning Outcomes

  • Outcome 1. Built knowledge across descriptive and inferential statistics and R.
  • Outcome 2. Applied descriptive and inferential statistics to dataset, considering variable types and type of test.
  • Outcome 3. Critically evaluated and interpreted results, observing p-values, frequency tables, test statistics and relevant literature.
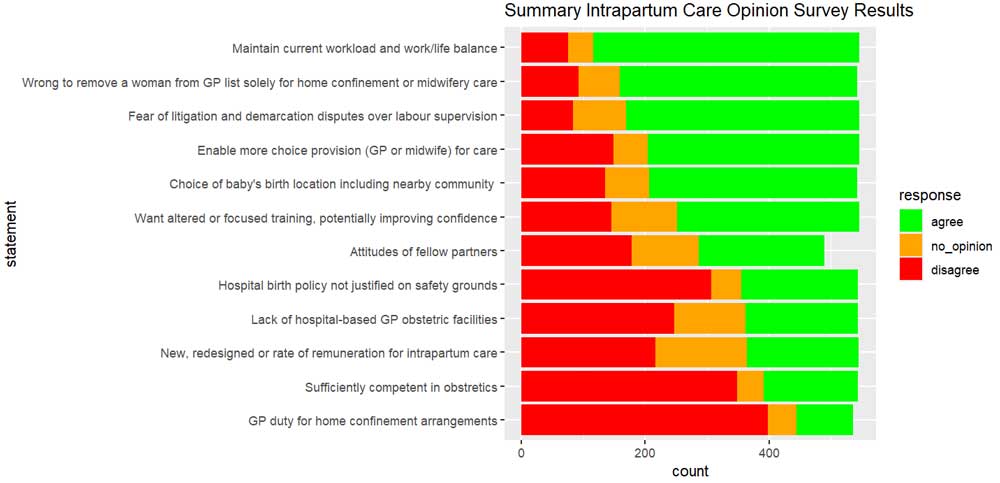
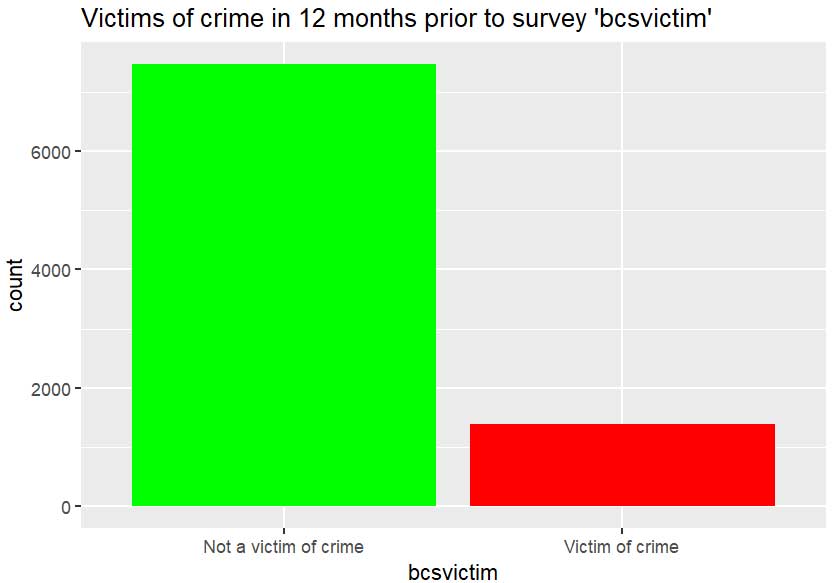
  • Outcome 4. Presented results to a diverse audience using both tables containing key statistical data and graphical representation in charts and plots.

Skills

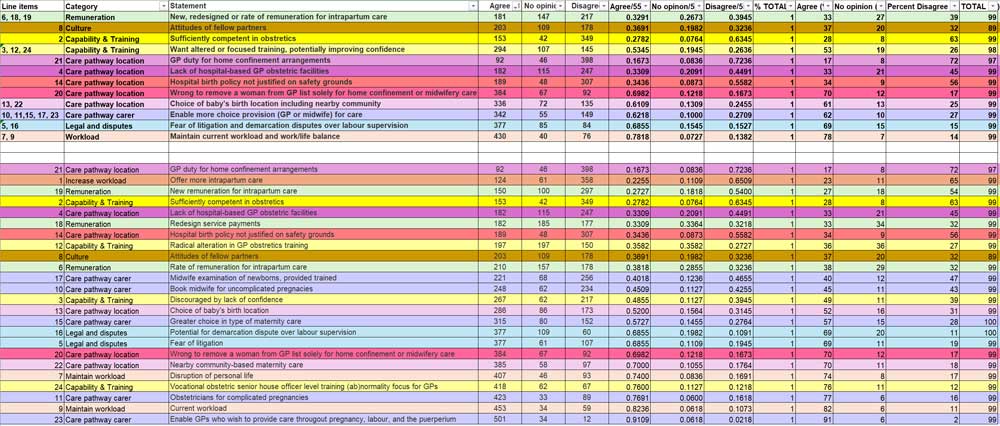
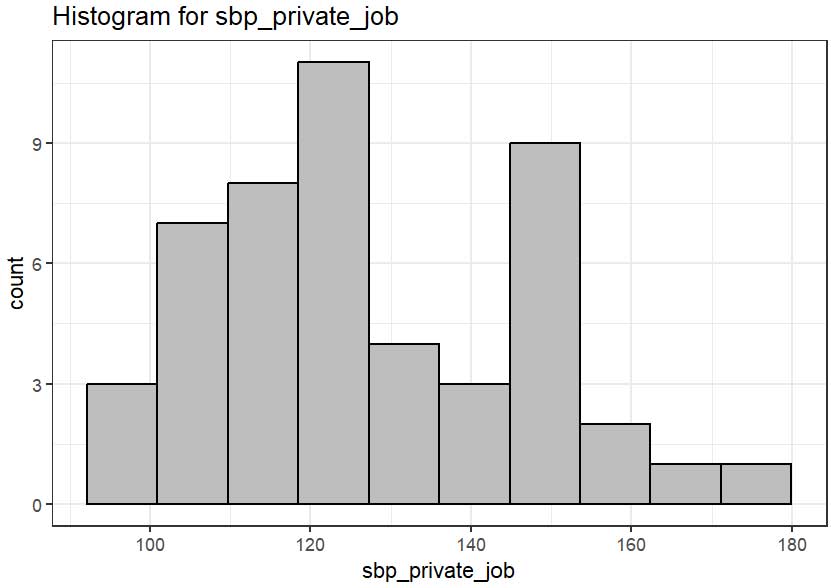
  • Descriptive Statistics. Five-figure summaries (min, max, range, median, Q1, Q3), mean, mode, frequency tables, contingency tables.
  • Inferential Statistics: Normality. Shapiro-Wilk, Anderson-Darling.
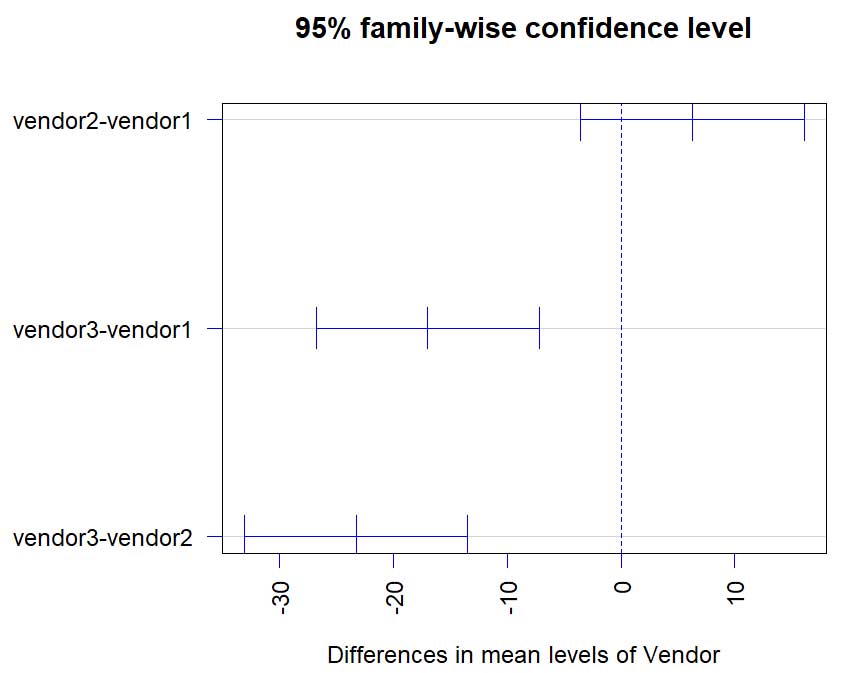
  • Inferential Statistics: Statistical tests. Chi-squared, Mann-Whitney U, Spearman's Correlation, Cramer's V.
  • Technical. GitHub, JASP, RStudio, R, SPSS data format
  • R: Script. Libraries, functions, data manipulation, ggplot, statistics functions.
  • R: Graphics. Pie charts, box plots, bar chart, density plot, histograms, Q-Q plots and scatterplots.
  • Communication. PowerPoint presentation with audio track and transcript.

Tutor Feedback

TBC

Topic

Transform main data table in Brown's 1994 paper to simplify it, visualise it, and reflect on the experience.

Bar chart Bar chart

Learning Outcomes

  • Outcome 1. Data presentation can add clarity or mislead. Good planning is essential to interpretation.
  • Outcome 2. Visualising helps quickly understand data, but data first requires processing. I used a stacked bar chart.
  • Outcome 3. The paper implied that 550 answered every question. Evident from the bar chart, they did not.
  • Outcome 4. Grouping data into understandable subgroups and visualising it is essential.

Skills

  • Technical. Excel, R, RStudio.
  • R. Libraries, functions, data manipulation, ggplot, stacked bar chart.

Feedback

Ungraded. No peer responses.

Topic: Crime Survey

Using the Crime Survey for England and Wales, 2013-2014: Unrestricted Access Teaching Dataset, implement the following in R:

  • 1: Assess level of anti-social behaviour that the survey respondents experience in their neighbourhood by creating a summary statistic, using the antisocx variable.
  • 2: Using the bcsvictim variable, explore whether survey respondents experienced crime in previous 12 months, create a frequency table and convert into a factor variable.
  • 3: Create a subset of individuals who belong to 75+ age group and who were a victim of crime. Save as crime_75victim.
  • 4: Create boxplot for antisocx variable, plot in yellow, outliers in red. Create a bar plot for bcsvictim variable.
Crime Survey

Learning Outcomes

  • Outcome 1. Learned how to use R to read and manipulate data sets.
  • Outcome 2. Used R to create statistical tools like frequency table which indicates mode.

Skills

  • Technical. R, RStudio.
  • R. Libraries, data manipulation, descriptive statistics, frequency table, ggplot, box plot, bar chart.

Topic: Health Data

Using Health Data perform the following in R:

  • 5: Find out mean, median and mode for systolic, diastolic blood pressure and income. Income five-figure summary and boxplot. Hypothesis test on association between systolic and absence of peptic ulcer.
  • 6: Mean, median and mode of age. Whether median diastolic blood pressure is same among diabetic and non-diabetic participants. Whether systolic BP is different across occupational group.
Health Data

Learning Outcomes

  • Outcome 1. Understood hypothesis testing, including descriptive, grahical and normality tests.
  • Outcome 2. Learned how to test for whether parametric or non-parametric and ran t-test, Mann-Whitney U test and Kruskal-Wallis test.
  • Outcome 3. Utilised graphing and tests and learned how to interpret test results using the p-value.

Skills

  • Statistical. Descriptive statistics, normality tests, non-parametric tests, hypothesis
  • Technical. R, RStudio.
  • R. Libraries, data manipulation, descriptive statistics, ggplot (Q-Q plot, histogram), tests (t-test, Shapiro-Wilk, Mann-Whitney U, Kruskal-Wallis.)

Topic: Confidence Interval

Calculate mean efficiency of 3 groups of vendor scores and determine which vendor shows a higher significance of improvement in its employee efficiency statistically at the 95% level.

95% Confidence Interval

Learning Outcomes

  • Outcome 1. Further used R to understand three-variable tests, post-hoc analysis and 95% confidence intervals.
  • Outcome 2. Again, tested for parametric or non-parametric and ran various plots, ANOVA and Tukey.
  • Outcome 3. Learned how to interpret test results using the p-value and 95% confidence interval of difference in means. Vendors 1 and 2 mean scores were significantly higher than vendor 3, however, neither was statistically better.

Skills

  • Statistical. Descriptive statistics, normality tests, ANOVA, Tukey.
  • Technical. R, RStudio.
  • R. Libraries, data manipulation, descriptive statistics, ggplot (Q-Q plot, box plot, histogram, scatterplot), tests (Shapiro-Wilk, Levene, ANOVA, Tukey.)

Reflections

Critical reflection on learning

SWOT Analysis

SWOT

Learning Outcomes

  • Outcome 3. Critically evaluated my experience of using statistical analysis and R to interpret results and make decisions.

Tutor Feedback

TBC

Reflection available upon request.